阶段1: 将 dzbj 项目的 LVGL 8.3.11 LCD 显示集成到 AI小智 主项目,
开机显示 ScreenHome 界面,同时优化配网模式下的内存使用,
确保 WiFi+BLE+LVGL 三者共存运行。

## 新增功能

### dzbj 显示模块集成
- 新增 main/dzbj/ 目录,移植 LCD 驱动(ST77916 QSPI)、触摸驱动(CST816S)、
  LVGL 初始化和 SquareLine Studio UI 界面
- I2C 总线共享:dzbj 触摸控制器复用主项目的 I2C_NUM_1 总线
- GPIO 冲突解决:LED(GPIO21)、Touch1(GPIO1)、Touch4(GPIO7) 改为 NC,
  电池 ADC 从 GPIO6 改为 GPIO3
- 添加 LVGL、esp_lcd_st77916、esp_lcd_touch_cst816s 等组件依赖
- managed_components 纳入版本管理

### 配网模式轻量化启动
- BoxAudioCodec: 新增 output_only 模式,仅创建 I2S TX 通道(省 ~13KB DMA)
  跳过 ES7210 ADC 初始化(省 ~2-4KB)
- AudioCodec: 新增 StartOutputOnly() 方法,仅启用扬声器输出
- Application: 配网模式跳过 Opus 编码器、输入重采样器、协议初始化、
  天气位置检测等网络业务
- 板级构造函数: 配网模式跳过电池检测、IMU传感器、PowerSaveTimer

### WifiBoard 配网流程修复
- NeedsProvisioning() 静态方法: 读取 NVS force_ap 和 SSID 列表,
  用于提前判断配网模式
- force_ap 竞态修复: 构造函数不再清零 force_ap,改在 StartNetwork() 清零,
  确保 NeedsProvisioning() 能正确读到 force_ap=1
- Application 缓存 provisioning_mode_ 成员变量,避免重复读 NVS

### BLE 配网重启修复
- 配网成功后用 esp_timer 延迟重启替代 xTaskCreate,
  避免内存紧张时任务创建失败导致设备不重启
- 注释掉 WiFi 连接成功后的 MAC 地址发送步骤

### sdkconfig 内存优化
- BT_ALLOCATION_FROM_SPIRAM_FIRST=y (BLE 动态分配优先 PSRAM)
- SPIRAM_MALLOC_RESERVE_INTERNAL=32768
- NVS_ALLOCATE_CACHE_IN_SPIRAM=y
- WiFi 静态缓冲区数量优化 (RX=10, TX=8)

Co-Authored-By: Claude Opus 4.6 <noreply@anthropic.com>
5.3 KiB
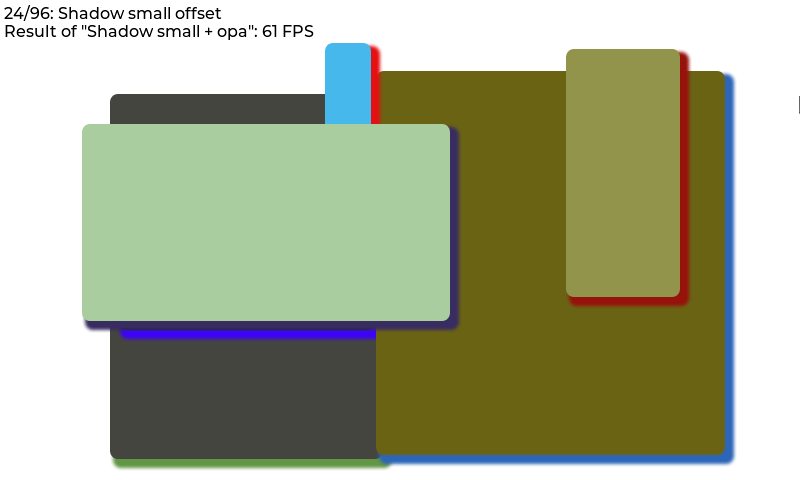
Benchmark demo
Overview
The benchmark demo tests the performance in various cases. For example rectangle, border, shadow, text, image blending, image transformation, blending modes, etc. All tests are repeated with 50% opacity.
The size and position of the objects during testing are set with a pseudo random number to make the benchmark repeatable.
On to top of the screen the title of the current test step, and the result of the previous step is displayed.
Run the benchmark
- In
lv_conf.hor equivalent places setLV_USE_DEMO_BENCHMARK 1 - After
lv_init()and initializing the drivers calllv_demo_benchmark() - If you only want to run a specific scene for any purpose (e.g. debug, performance optimization etc.), you can call
lv_demo_benchmark_run_scene()instead oflv_demo_benchmark()and pass the scene number. - If you enabled trace output by setting macro
LV_USE_LOGto1and trace levelLV_LOG_LEVELtoLV_LOG_LEVEL_USERor higher, benchmark results are printed out incsvformat. - If you want to know when the testing is finished, you can register a callback function via
lv_demo_benchmark_register_finished_handler()before callinglv_demo_benchmark()orlv_demo_benchmark_run_scene(). - If you want to know the maximum rendering performance of the system, call
lv_demo_benchmark_set_max_speed(true)beforelv_demo_benchmark().
Interpret the result
The FPS is measured like this:
- load the next step
- in the display driver's
monitor_cbaccumulate the time-to-render and the number of cycles - measure for 1 second
- calculate
FPS = time_sum / render_cnt
Note that it can result in very high FPS results for simple cases.
E.g. if some simple rectangles are drawn in 5 ms, the benchmark will tell it's 200 FPS.
So it ignores LV_DISP_REFR_PERIOD which tells LVGL how often it should refresh the screen.
In other words, the benchmark shows the FPS from the pure rendering time.
By default, only the changed areas are refreshed. It means if only a few pixels are changed in 1 ms the benchmark will show 1000 FPS. To measure the performance with full screen refresh uncomment lv_obj_invalidate(lv_scr_act()) in monitor_cb() in lv_demo_benchmark.c.
If you are doing performance analysis for 2D image processing optimization, LCD latency (flushing data to LCD) introduced by disp_flush() might dilute the performance results of the LVGL drawing process, hence make it harder to see your optimization results (gain or loss). To avoid such problem, please:
- Use a flag to control the LCD flushing inside
disp_flush(). For example:
volatile bool disp_flush_enabled = true;

/* Enable updating the screen (the flushing process) when disp_flush() is called by LVGL
 */
void disp_enable_update(void)
{
    disp_flush_enabled = true;
}

/* Disable updating the screen (the flushing process) when disp_flush() is called by LVGL
 */
void disp_disable_update(void)
{
    disp_flush_enabled = false;
}

static void disp_flush(lv_disp_drv_t * disp_drv, const lv_area_t * area, lv_color_t * color_p)
{
    if(disp_flush_enabled) {
        GLCD_DrawBitmap(area->x1,                   //!< x
                        area->y1,                   //!< y
                        area->x2 - area->x1 + 1,    //!< width
                        area->y2 - area->y1 + 1,    //!< height
                        (const uint8_t *)color_p);
    }

    /*IMPORTANT!!!
     *Inform the graphics library that you are ready with the flushing*/
    lv_disp_flush_ready(disp_drv);
}
- Disable flushing before calling
lv_demo_benchmark()orlv_demo_benchmark_run_scene(), for example:
extern void disp_enable_update(void);
extern void disp_disable_update(void);

static void on_benchmark_finished(void)
{
    disp_enable_update();
}

int main(void)
{
    lv_init();
    lv_port_disp_init();
    lv_port_indev_init();

    LV_LOG("Running LVGL Benchmark...");
    LV_LOG("Please stand by...");
    LV_LOG("NOTE: You will NOT see anything until the end.");

    disp_disable_update();

    lv_demo_benchmark_set_finished_cb(&on_benchmark_finished);
    lv_demo_benchmark_set_max_speed(true);
    lv_demo_benchmark();

    //lv_demo_benchmark_run_scene(43);      // run scene no 31

    ...
    while(1){
        lv_timer_handler();                 //! run lv task at the max speed
    }
}
- Alternatively, you can use trace output to get the benchmark results in csv format by:
- Setting macro
LV_USE_LOGto1 - Setting trace level
LV_LOG_LEVELtoLV_LOG_LEVEL_USERor higher.
- Setting macro
Result summary
In the end, a table is created to display measured FPS values.
On top of the summary screen, the "Weighted FPS" value is shown. In this, the result of the more common cases are taken into account with a higher weight.
"Opa. speed" shows the speed of the measurements with opacity compared to full opacity. E.g. "Opa. speed = 90%" means that rendering with opacity is 10% slower.
In the first section of the table, "Slow but common cases", those cases are displayed which are considered common but were slower than 20 FPS.
Below this in the "All cases section" all the results are shown. The < 10 FPS results are shown with red, the >= 10 but < 20 FPS values are displayed with orange.
